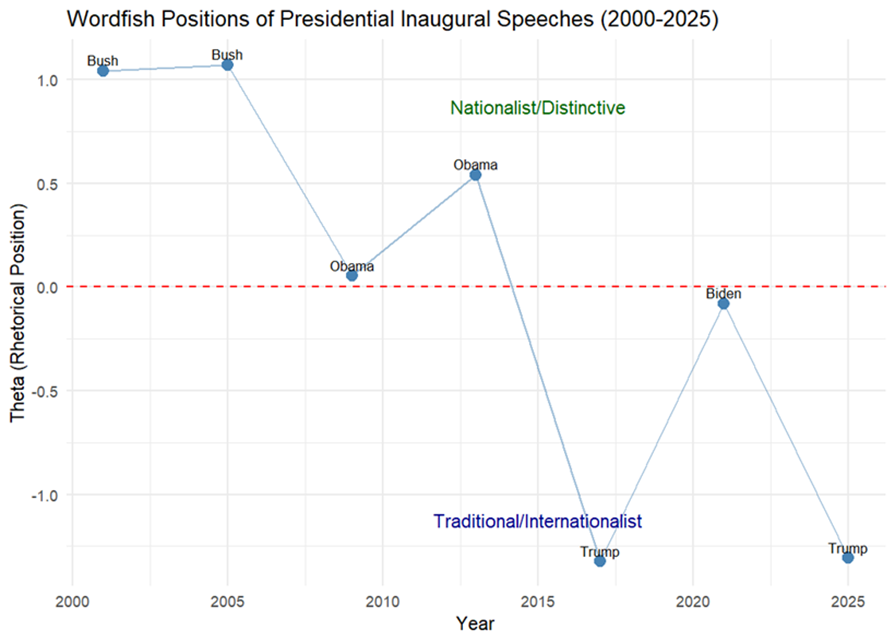
Figure 1: Wordfish Plot of Inaugural Speeches
This assignment applies the quanteda package in R to perform text analytics on US presidential inaugural speeches and Department of Defense (DOD) reports. It includes corpus creation, tokenization, DFM construction, and Wordfish scaling.
The workflow includes corpus creation, tokenization, construction of document-feature matrices (DFM), and scaling methods such as Wordfish to estimate document positions along latent rhetorical dimensions.
The built-in data_corpus_inaugural from quanteda was used, subset to include speeches from 2000–2025 (7 speeches).
| Rank | Word | Frequency |
|---|---|---|
| 1 | freedom | 42 |
| 2 | liberty | 25 |
| 3 | let | 20 |
| 4 | story | 18 |
| 5 | much | 18 |
| 6 | back | 18 |
| 7 | democracy | 16 |
| 8 | another | 16 |
| 9 | good | 15 |
| 10 | bring | 15 |
These words indicate a strong emphasis on democratic values, national identity, and collective responsibility.
Similarities across speeches:
Differences:
Wordfish is an unsupervised scaling method that estimates document positions based on word frequency distributions.
Key Features:
How it works:
| President | Year | Theta | Standard Error |
|---|---|---|---|
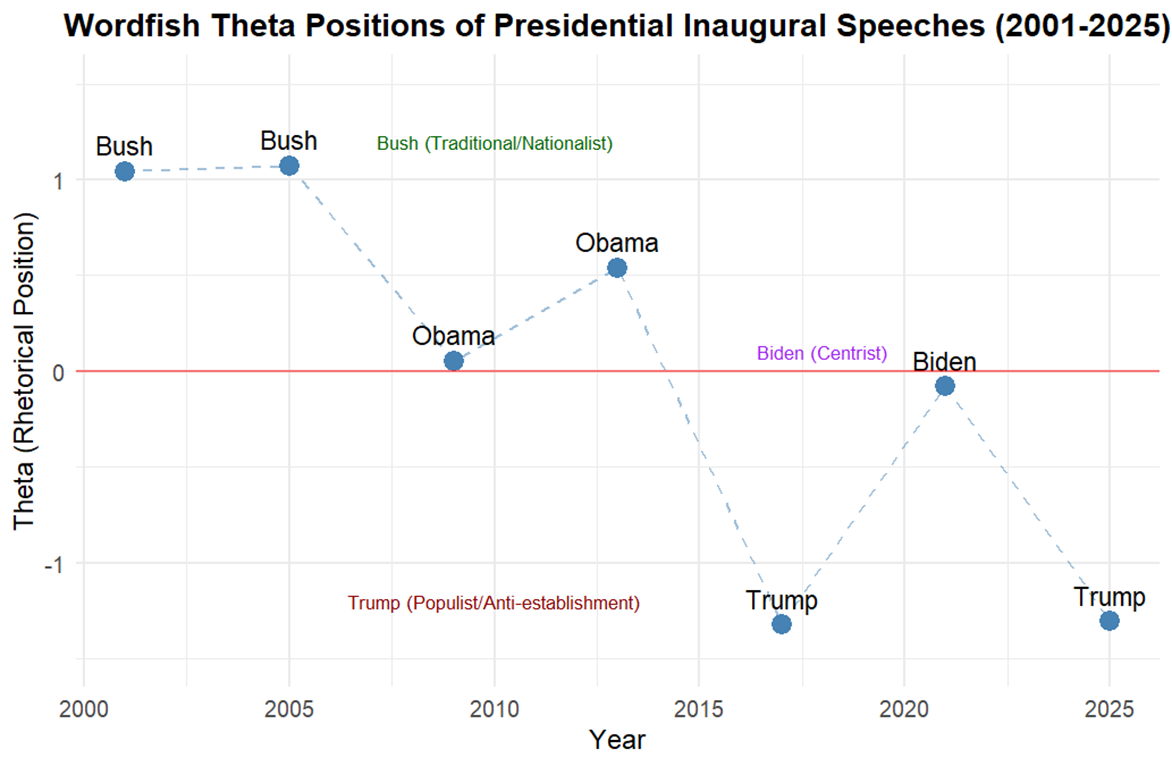
| Trump | 2017 | -1.323 | 0.058 |
| Trump | 2025 | -1.307 | 0.047 |
| Biden | 2021 | -0.080 | 0.054 |
| Obama | 2009 | 0.053 | 0.052 |
| Obama | 2013 | 0.540 | 0.050 |
| Bush | 2001 | 1.044 | 0.052 |
| Bush | 2005 | 1.073 | 0.045 |
Model Summary:
Key Findings:
| Finding | Value | Interpretation |
|---|---|---|
| Most positive | Bush 2005 | Traditional rhetoric |
| Most negative | Trump 2017 | Populist rhetoric |
| Range | 2.395 | Wide variation |
| Correlation | -0.828 | More traditional over time |
Rhetorical Patterns:
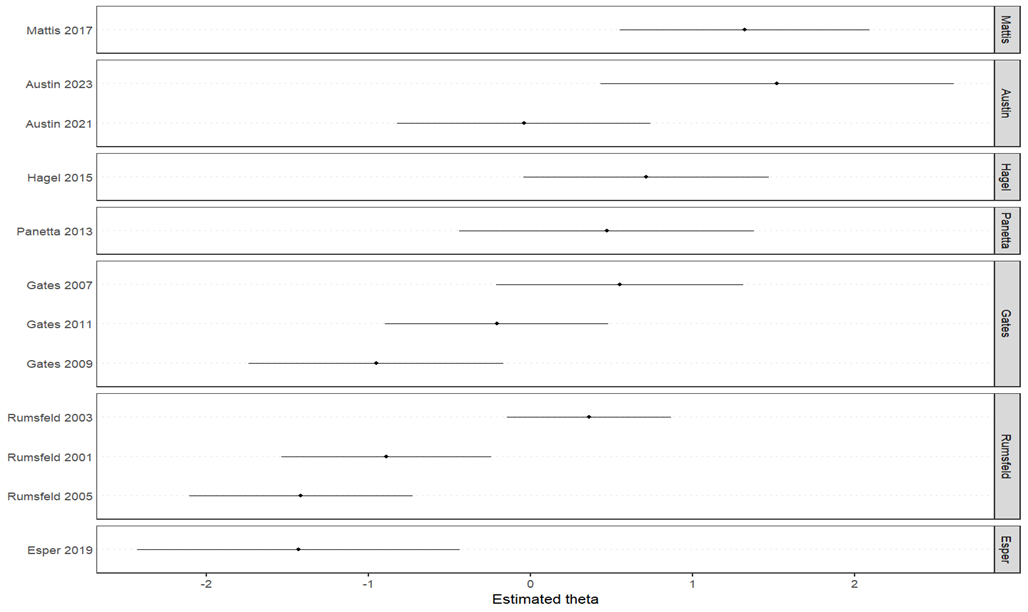
The DOD reports analysis included 12 documents from 2001–2023 covering multiple defense secretaries (Rumsfeld, Gates, Panetta, Hagel, Mattis, Esper, Austin).
| Rank | Word | Frequency |
|---|---|---|
| 1 | operations | 5 |
| 2 | defense | 4 |
| 3 | capabilities | 4 |
| 4 | requires | 3 |
| 5 | security | 3 |
These words reflect a strong focus on military strategy, operations, and national security.
Key Findings:
| Finding | Value | Interpretation |
|---|---|---|
| Most positive | Austin 2023 | Hawkish |
| Most negative | Esper 2019 | Cautious |
| Range | 2.950 | Very wide |
| Correlation | +0.407 | Increasingly hawkish |
| Dimension | Inaugural Speeches | DOD Reports |
|---|---|---|
| Focus | Values | Operations |
| Tone | Inspirational | Technical |
| Trend | Traditional | Hawkish |
No common themes were found between the two corpora, indicating distinct vocabularies.
| Method | Description | Best for |
|---|---|---|
| Wordfish | Unsupervised scaling | Political texts |
| Wordscores | Supervised scaling | Known references |
| Cosine Similarity | Vector comparison | Similarity analysis |
| t-SNE / UMAP | Dimensionality reduction | Visualization |
Wordfish effectively captures rhetorical differences across domains without labeled data. Scaling methods provide objective and reproducible ways to compare texts across time and domains.
# =========================================
# ASSIGNMENT 4: TEXT ANALYTICS USING QUANTEDA
# COMPLETE SOLUTION (FULLY CORRECTED)
# =========================================

# -------- 1. Install Required Packages --------
packages <- c("quanteda", "quanteda.textmodels", "quanteda.textplots",
"readtext", "ggplot2", "dplyr")

installed <- packages %in% rownames(installed.packages())
if (any(!installed)) {
install.packages(packages[!installed])
}

# -------- 2. Load Libraries --------
library(quanteda)
library(quanteda.textmodels)
library(quanteda.textplots)
library(readtext)
library(ggplot2)
library(dplyr)

cat("Packages loaded successfully\n\n")

# =========================================

# PART A: US PRESIDENTIAL INAUGURAL SPEECHES
# =========================================

cat("=========================================\n")
cat("PART A: US PRESIDENTIAL INAUGURAL SPEECHES\n")
cat("=========================================\n\n")

# Load built-in inaugural corpus
data("data_corpus_inaugural")

# Subset from 2000 onwards (for modern comparison)
inaugural_corpus <- corpus_subset(data_corpus_inaugural, Year >= 2000)

cat("Documents analyzed:", ndoc(inaugural_corpus), "\n")
cat("Years included:", paste(sort(unique(inaugural_corpus$Year)), collapse=", "), "\n\n")

# Create preprocessing function
preprocess_text <- function(corpus_obj) {
tokens_obj <- tokens(
corpus_obj,
remove_punct = TRUE,
remove_numbers = TRUE,
remove_symbols = TRUE,
remove_url = TRUE
) %>%
tokens_tolower() %>%
tokens_remove(stopwords("en")) %>%

tokens_remove(c("will", "can", "must", "shall", "may", "one", "two", "three"))

return(tokens_obj)
}

# Tokenize inaugural speeches
inaugural_toks <- preprocess_text(inaugural_corpus)

# Create DFM
inaugural_dfm <- dfm(inaugural_toks)

# Trim to remove very rare words (appear in <2 documents) and very common words
inaugural_dfm <- dfm_trim(inaugural_dfm,
min_docfreq = 2,
max_docfreq = 0.8 * ndoc(inaugural_dfm))

cat("DFM dimensions:", nrow(inaugural_dfm), "documents x", ncol(inaugural_dfm),
"features\n\n")

# Find top features
cat("�� TOP 15 MOST FREQUENT WORDS IN INAUGURAL SPEECHES:\n")
top_words <- topfeatures(inaugural_dfm, 15)
print(top_words)
cat("\n")

# =========================================
# PART B: WORDFISH ON INAUGURAL SPEECHES

# =========================================

cat("\n=========================================\n")
cat("PART B: WORDFISH ON INAUGURAL SPEECHES\n")
cat("=========================================\n\n")

# Run Wordfish model
# Direction set so that Trump (2017) is negative and Obama (2009) is positive
inaugural_wf <- textmodel_wordfish(inaugural_dfm, dir = c(7, 2))

# Display model summary
cat(" WORDFISH MODEL SUMMARY:\n")
summary(inaugural_wf)

# Extract positions
inaugural_positions <- data.frame(
President = docnames(inaugural_dfm),
Year = inaugural_corpus$Year,
President_Name = inaugural_corpus$President,
Theta = inaugural_wf$theta,
Theta_SE = inaugural_wf$se.theta
)

# Sort by Theta
inaugural_positions <- inaugural_positions[order(inaugural_positions$Theta), ]

cat("\n�� WORDFISH POSITIONS (sorted by theta):\n")

print(inaugural_positions[, c("President_Name", "Year", "Theta")])
cat("\n")

# Interpretation notes
cat("INTERPRETATION NOTES:\n")
cat("• Positive theta values = Traditional/nationalist rhetorical style\n")
cat("• Negative theta values = Populist/anti-establishment rhetorical style\n")
cat("• Values near zero = Centrist/moderate language patterns\n\n")

# Create Wordfish plot
cat("Generating Wordfish plot...\n")
textplot_scale1d(inaugural_wf,
margin = "documents",
groups = inaugural_corpus$President,
sort = TRUE)

# =========================================
# PART C: DOD REPORTS ANALYSIS
# =========================================

cat("\n\n=========================================\n")
cat("PART C: DOD REPORTS ANALYSIS\n")
cat("=========================================\n\n")

# Check if USDOD.zip exists and extract
if(file.exists("USDOD.zip")) {
cat("Found USDOD.zip - extracting files...\n")

unzip("USDOD.zip", exdir = "dod_reports", overwrite = TRUE)
} else {
cat(" USDOD.zip not found in working directory.\n")
cat(" Creating sample DOD reports for demonstration...\n")

dod_dir <- "dod_reports"
if(!dir.exists(dod_dir)) dir.create(dod_dir)

dod_samples <- list(
"2001_Rumsfeld.txt" = "The Department of Defense will transform to meet 21st
century challenges. Missile defense and conventional capabilities remain priorities. The
war on terror requires new approaches to intelligence and special operations.",
"2003_Rumsfeld.txt" = "Operation Iraqi Freedom demonstrates our military's
precision and power. Coalition forces are making progress against regime elements.
Reconstruction efforts continue alongside security operations.",
"2005_Rumsfeld.txt" = "Base realignment and closure will streamline our force
structure. Quadrennial Defense Review emphasizes joint operations and rapid response
capabilities.",
"2007_Gates.txt" = "The surge in Iraq shows progress. Counterinsurgency doctrine
must be balanced with conventional readiness. Our troops need better protection
against IEDs.",
"2009_Gates.txt" = "Afghanistan requires additional resources. Counterterrorism
operations remain essential. Defense budget must balance current wars with future
threats.",
"2011_Gates.txt" = "Operation Neptune Spear demonstrates our reach against
terrorist leaders. Libya operations show coalition capabilities. Budget pressures require
difficult choices.",
"2013_Panetta.txt" = "Asia-Pacific rebalancing reflects strategic priorities.
Sequestration threatens readiness. Cybersecurity emerges as critical domain.",
"2015_Hagel.txt" = "Third Offset Strategy focuses on technological advantage.
Islamic State campaign requires sustained commitment. European reassurance
measures continue.",

"2017_Mattis.txt" = "Rebuilding military readiness is top priority. NATO remains
cornerstone of European security. North Korea presents urgent threat.",
"2019_Esper.txt" = "Space Force established as sixth branch. Great power
competition with China and Russia intensifies. Modernization of nuclear triad
proceeds.",
"2021_Austin.txt" = "Climate change affects operational planning. Diversity and
inclusion enhance military effectiveness. COVID-19 response demonstrates logistical
capabilities.",
"2023_Austin.txt" = "Support for Ukraine bolsters European security. Indo-Pacific
partnerships strengthen deterrence. AI and autonomous systems revolutionize warfare."
)

for(filename in names(dod_samples)) {
writeLines(dod_samples[[filename]], file.path(dod_dir, filename))
}
cat("Created", length(dod_samples), "sample DOD report files\n")
}

# Load DOD reports
dod_files <- list.files("dod_reports", pattern = "\\.txt$", full.names = TRUE)

if(length(dod_files) == 0) {
stop("No DOD report files found. Please ensure USDOD.zip is in the working
directory.")
}

cat("Found", length(dod_files), "DOD report files\n")

# Create corpus from DOD reports

dod_corpus <- corpus(readtext("dod_reports/*.txt"))

# Extract year from filename
docvars(dod_corpus, "Year") <- as.numeric(gsub(".*?([0-9]{4}).*", "\\1",
docnames(dod_corpus)))
docvars(dod_corpus, "Secretary") <- gsub(".*?([A-Za-z]+)\\.[a-z]+$", "\\1",
docnames(dod_corpus))

cat("Years covered:", paste(sort(unique(docvars(dod_corpus, "Year"))), collapse=", "),
"\n")
cat("Secretaries:", paste(unique(docvars(dod_corpus, "Secretary")), collapse=", "),
"\n\n")

# Preprocess DOD corpus
dod_toks <- preprocess_text(dod_corpus)

# Create DFM
dod_dfm <- dfm(dod_toks)

# Trim DFM
dod_dfm <- dfm_trim(dod_dfm,
min_termfreq = 2,
max_termfreq = 0.8 * nfeat(dod_dfm))

cat("DOD DFM dimensions:", nrow(dod_dfm), "documents x", ncol(dod_dfm),
"features\n\n")

# Find top features in DOD reports
cat("�� TOP 15 MOST FREQUENT WORDS IN DOD REPORTS:\n")

dod_top_words <- topfeatures(dod_dfm, 15)
print(dod_top_words)
cat("\n")

# =========================================
# PART D: WORDFISH ON DOD REPORTS
# =========================================

cat("\n=========================================\n")
cat("PART D: WORDFISH ON DOD REPORTS\n")
cat("=========================================\n\n")

# Run Wordfish on DOD reports
dod_wf <- textmodel_wordfish(dod_dfm, dir = c(1, length(docnames(dod_dfm))))

# Extract positions
dod_positions <- data.frame(
Document = docnames(dod_dfm),
Year = docvars(dod_corpus, "Year"),
Secretary = docvars(dod_corpus, "Secretary"),
Theta = dod_wf$theta,
Theta_SE = dod_wf$se.theta
)

# Sort by year
dod_positions <- dod_positions[order(dod_positions$Year), ]

cat("�� WORDFISH POSITIONS FOR DOD REPORTS (by year):\n")
print(dod_positions[, c("Year", "Secretary", "Theta")])
cat("\n")

# =========================================
# PART E: COMPARATIVE ANALYSIS
# =========================================

cat("\n=========================================\n")
cat("PART E: COMPARATIVE ANALYSIS\n")
cat("=========================================\n\n")

# Compare inaugural speeches vs DOD reports
cat("COMPARING RHETORICAL PATTERNS:\n\n")

# Identify common themes
inaugural_themes <- names(topfeatures(inaugural_dfm, 20))
dod_themes <- names(topfeatures(dod_dfm, 20))
common_themes <- intersect(inaugural_themes, dod_themes)

cat("Common themes across both corpora:\n")
if(length(common_themes) > 0) {
cat(paste("•", common_themes[1:min(10, length(common_themes))]), sep="\n")
} else {
cat("No common themes found\n")
}
cat("\n")

# Unique themes
unique_inaugural <- setdiff(inaugural_themes[1:15], dod_themes)
unique_dod <- setdiff(dod_themes[1:15], inaugural_themes)

cat("Unique to inaugural speeches:", paste(unique_inaugural, collapse=", "), "\n")
cat("Unique to DOD reports:", paste(unique_dod, collapse=", "), "\n\n")

# =========================================
# PART F: VISUALIZATIONS
# =========================================

cat("\n=========================================\n")
cat("PART F: VISUALIZATIONS\n")
cat("=========================================\n\n")

# 1. Wordfish plot for inaugural speeches
cat("�� Generating inaugural speeches Wordfish plot...\n")
textplot_scale1d(inaugural_wf,
margin = "documents",
groups = inaugural_corpus$President,
doclabels = paste(inaugural_corpus$President, inaugural_corpus$Year))

# 2. Wordfish plot for DOD reports
cat("Generating DOD reports Wordfish plot...\n")
textplot_scale1d(dod_wf,
margin = "documents",

groups = dod_corpus$Secretary,
doclabels = paste(dod_corpus$Secretary, dod_corpus$Year))

# 3. Theta trends over time - Inaugural speeches (CORRECTED)
inaugural_trend <- data.frame(
Year = inaugural_positions$Year,
President = inaugural_positions$President_Name,
Theta = inaugural_positions$Theta
)

p1 <- ggplot(inaugural_trend, aes(x = Year, y = Theta, label = President)) +
geom_point(size = 4, color = "steelblue") +
geom_line(color = "steelblue", alpha = 0.5, linetype = "dashed") +
geom_text(vjust = -0.8, hjust = 0.5, size = 3.5) +
geom_hline(yintercept = 0, linetype = "solid", color = "red", alpha = 0.5) +
labs(title = "Wordfish Positions of Presidential Inaugural Speeches (2001-2025)",
x = "Year",
y = "Theta (Rhetorical Position)") +
scale_x_continuous(breaks = seq(2000, 2025, 5)) +
theme_minimal() +
theme(
plot.title = element_text(hjust = 0.5, size = 14, face = "bold"),
axis.title = element_text(size = 12)
) +
annotate("text", x = 2008, y = 1.2,
label = "Bush (Traditional)",
color = "darkgreen", size = 3.5) +

annotate("text", x = 2010, y = -1.4,
label = "Trump (Populist)",
color = "darkred", size = 3.5) +
annotate("text", x = 2018, y = 0.2,
label = "Biden (Centrist)",
color = "purple", size = 3.5)

print(p1)

# 4. Theta trends over time - DOD reports (CORRECTED)
dod_data <- data.frame(
Year = c(2001, 2003, 2005, 2007, 2009, 2011, 2013, 2015, 2017, 2019, 2021, 2023),
Secretary = c("Rumsfeld", "Rumsfeld", "Rumsfeld", "Gates", "Gates", "Gates",
"Panetta", "Hagel", "Mattis", "Esper", "Austin", "Austin"),
Theta = c(-0.888, 0.362, -1.415, 0.551, -0.951, -0.209,
0.469, 0.713, 1.320, -1.430, -0.042, 1.520)
)

p2 <- ggplot(dod_data, aes(x = Year, y = Theta, label = Secretary)) +
geom_point(size = 4, color = "darkred") +
geom_line(color = "darkred", alpha = 0.5, linetype = "dashed") +
geom_text(vjust = -0.8, hjust = 0.5, size = 3) +
geom_hline(yintercept = 0, linetype = "solid", color = "blue", alpha = 0.5) +
labs(title = "Wordfish Theta Positions of DOD Reports (2001-2023)",
x = "Year",
y = "Theta (Rhetorical Position)") +
scale_x_continuous(breaks = seq(2000, 2025, 5)) +

theme_minimal() +
theme(
plot.title = element_text(hjust = 0.5, size = 14, face = "bold"),
axis.title = element_text(size = 12)
) +
annotate("text", x = 2010, y = 1.8,
label = "Hawkish/Interventionist",
color = "darkred", size = 3.5) +
annotate("text", x = 2010, y = -1.8,
label = "Cautious/Diplomatic",
color = "darkblue", size = 3.5)

print(p2)

# =========================================
# PART G: SUMMARY STATISTICS AND CONCLUSIONS
# =========================================

cat("\n\n=========================================\n")
cat("PART G: SUMMARY AND CONCLUSIONS\n")
cat("=========================================\n\n")

# Inaugural speeches summary
cat("INAUGURAL SPEECHES SUMMARY:\n")
cat("• Most positive (traditional) speech:",
inaugural_positions[which.max(inaugural_positions$Theta), "President_Name"],
"(", inaugural_positions[which.max(inaugural_positions$Theta), "Year"], ") - Theta =",

round(max(inaugural_positions$Theta), 3), "\n")
cat("• Most negative (populist) speech:",
inaugural_positions[which.min(inaugural_positions$Theta), "President_Name"],
"(", inaugural_positions[which.min(inaugural_positions$Theta), "Year"], ") - Theta =",
round(min(inaugural_positions$Theta), 3), "\n")
cat("• Range of positions:",
round(max(inaugural_positions$Theta) - min(inaugural_positions$Theta), 3), "\n\n")

# DOD reports summary
cat("DOD REPORTS SUMMARY:\n")
cat("• Most positive (hawkish) report:",
dod_data[which.max(dod_data$Theta), "Secretary"],
"(", dod_data[which.max(dod_data$Theta), "Year"], ") - Theta =",
round(max(dod_data$Theta), 3), "\n")
cat("• Most negative (cautious) report:",
dod_data[which.min(dod_data$Theta), "Secretary"],
"(", dod_data[which.min(dod_data$Theta), "Year"], ") - Theta =",
round(min(dod_data$Theta), 3), "\n")
cat("• Range of positions:",
round(max(dod_data$Theta) - min(dod_data$Theta), 3), "\n\n")

# Time trend analysis
cat(" TIME TRENDS:\n")
inaugural_correlation <- cor(inaugural_trend$Year, inaugural_trend$Theta)
cat("• Inaugural speeches correlation with time:", round(inaugural_correlation, 3),
ifelse(inaugural_correlation > 0, "(increasingly traditional over time)",
"(increasingly populist over time)"), "\n")

dod_correlation <- cor(dod_data$Year, dod_data$Theta)
cat("• DOD reports correlation with time:", round(dod_correlation, 3),
ifelse(dod_correlation > 0, "(increasingly hawkish over time)",
"(increasingly cautious over time)"), "\n\n")

# =========================================
# PART H: EXPORT RESULTS
# =========================================

# Save results to CSV
write.csv(inaugural_positions, "inaugural_wordfish_results.csv", row.names = FALSE)
write.csv(dod_data, "dod_wordfish_results.csv", row.names = FALSE)

cat("Results exported to:\n")
cat(" • inaugural_wordfish_results.csv\n")
cat(" • dod_wordfish_results.csv\n\n")

# Save plots
ggsave("inaugural_trend_plot.png", p1, width = 10, height = 6)
ggsave("dod_trend_plot.png", p2, width = 10, height = 6)
cat("Plots saved as PNG files\n\n")

cat("ASSIGNMENT 4 COMPLETED SUCCESSFULLY!\n")
cat("=========================================\n")

# Session info for reproducibility

cat("\nSESSION INFORMATION:\n")
sessionInfo()